

Mapping the Domains of Space Technology with U.S. Government Spending Data
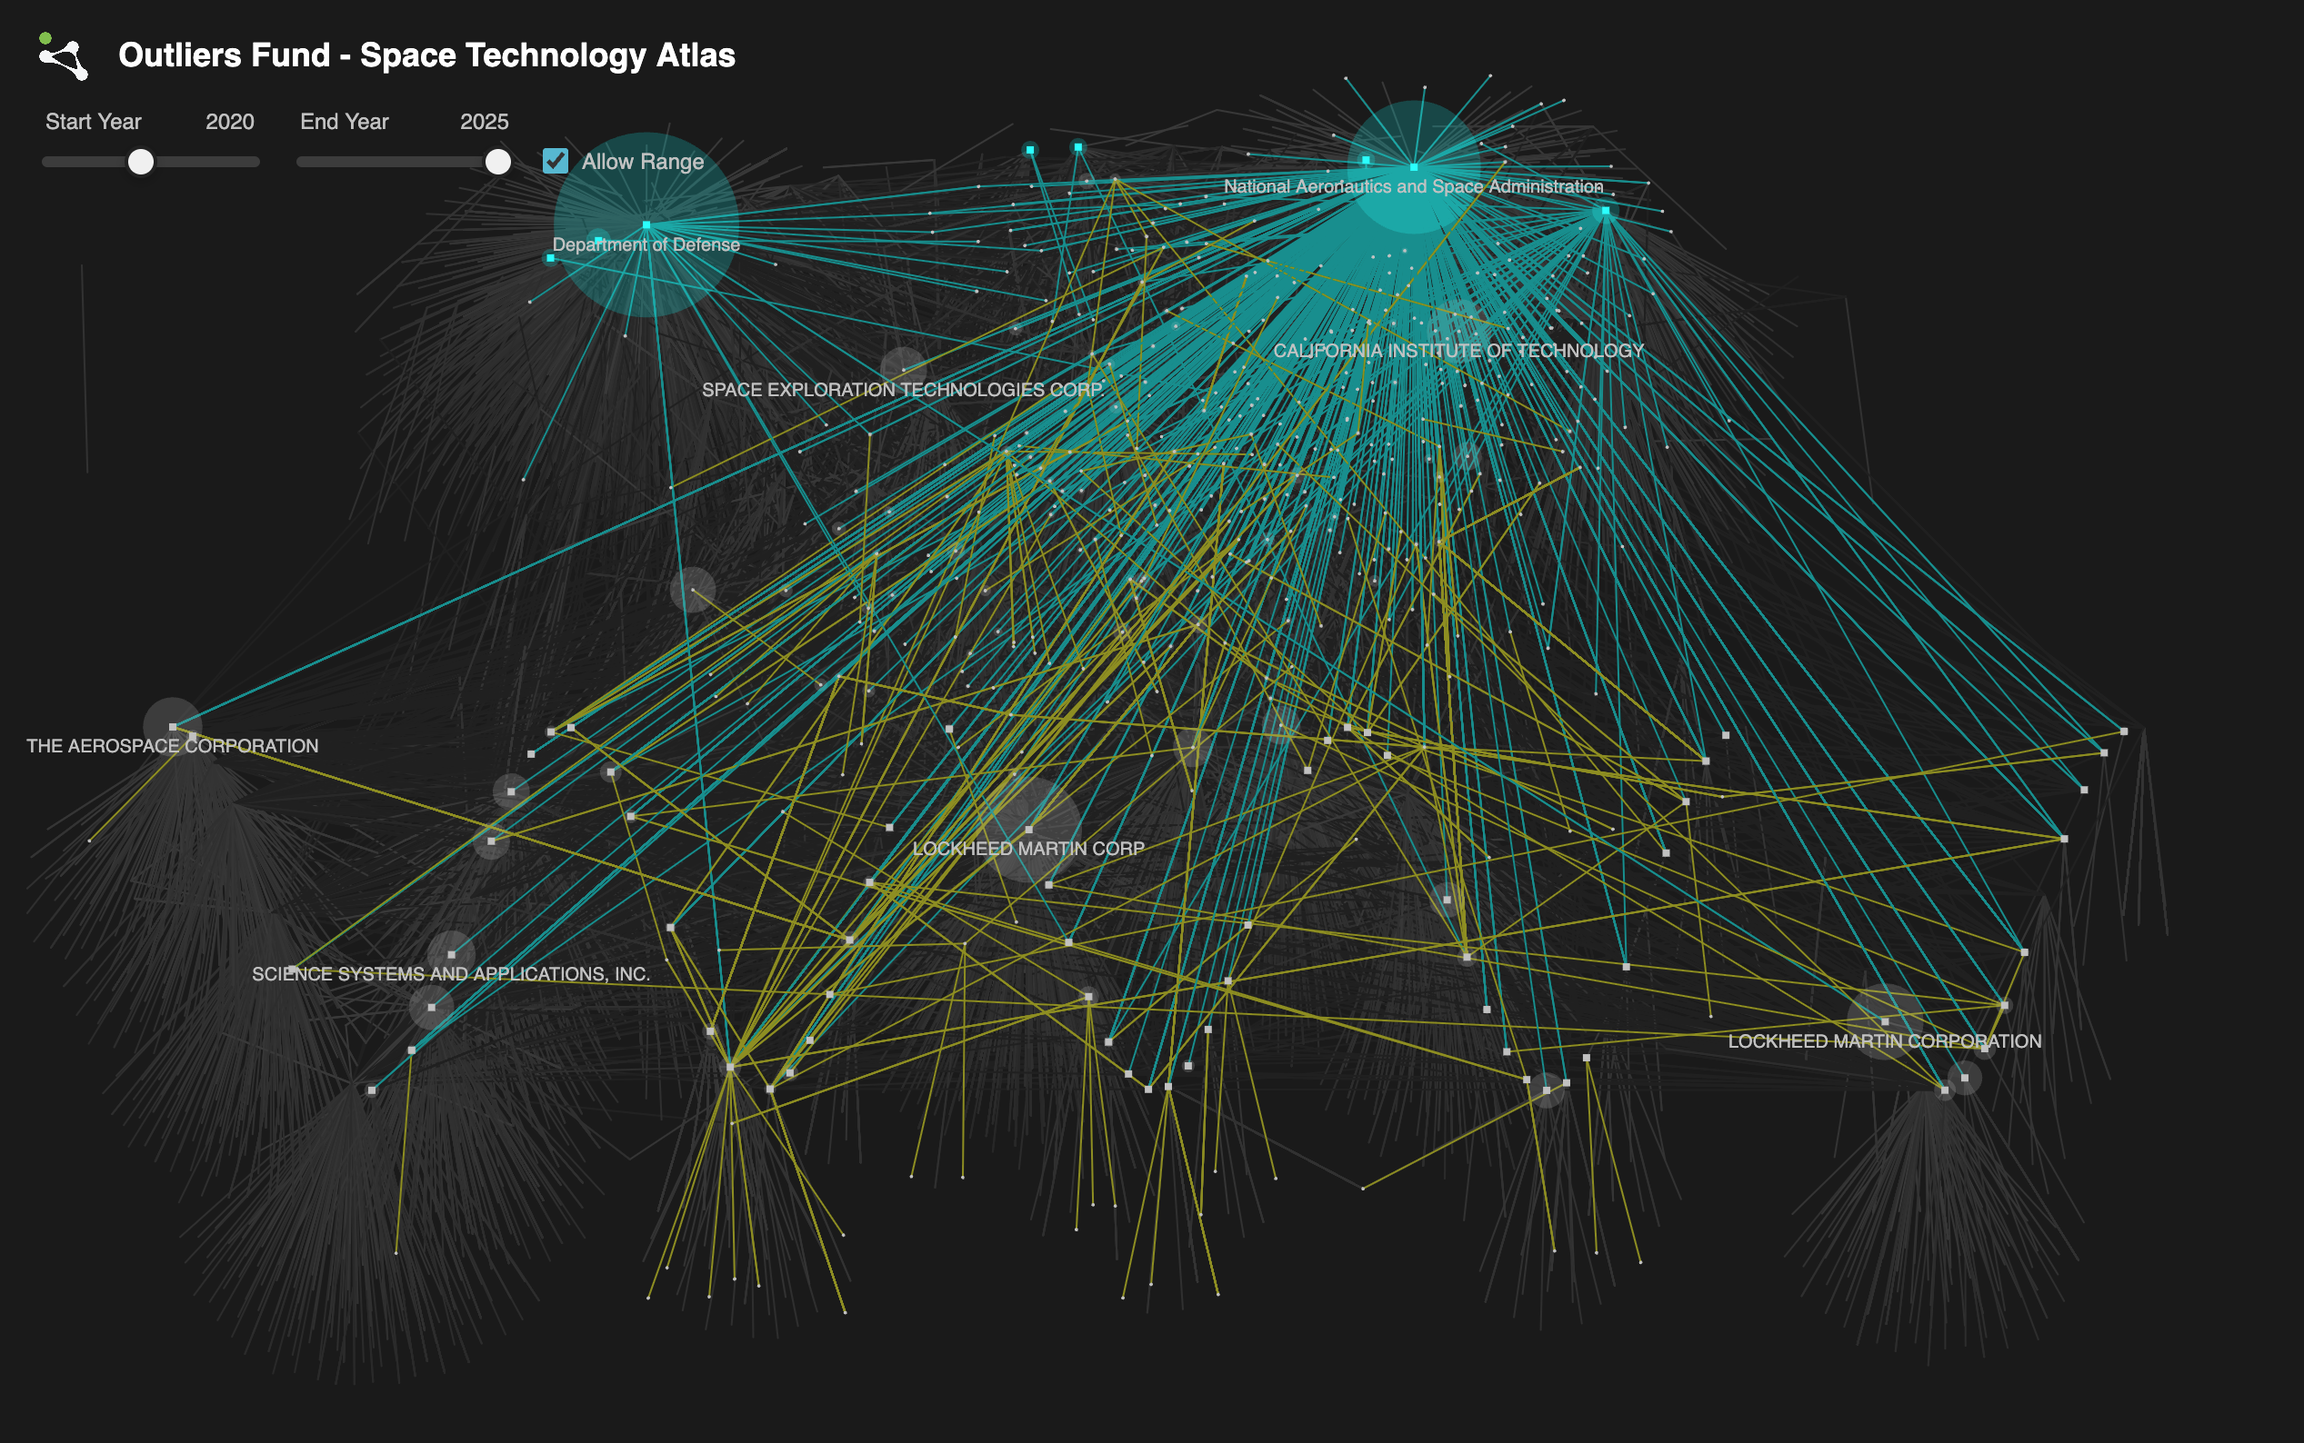
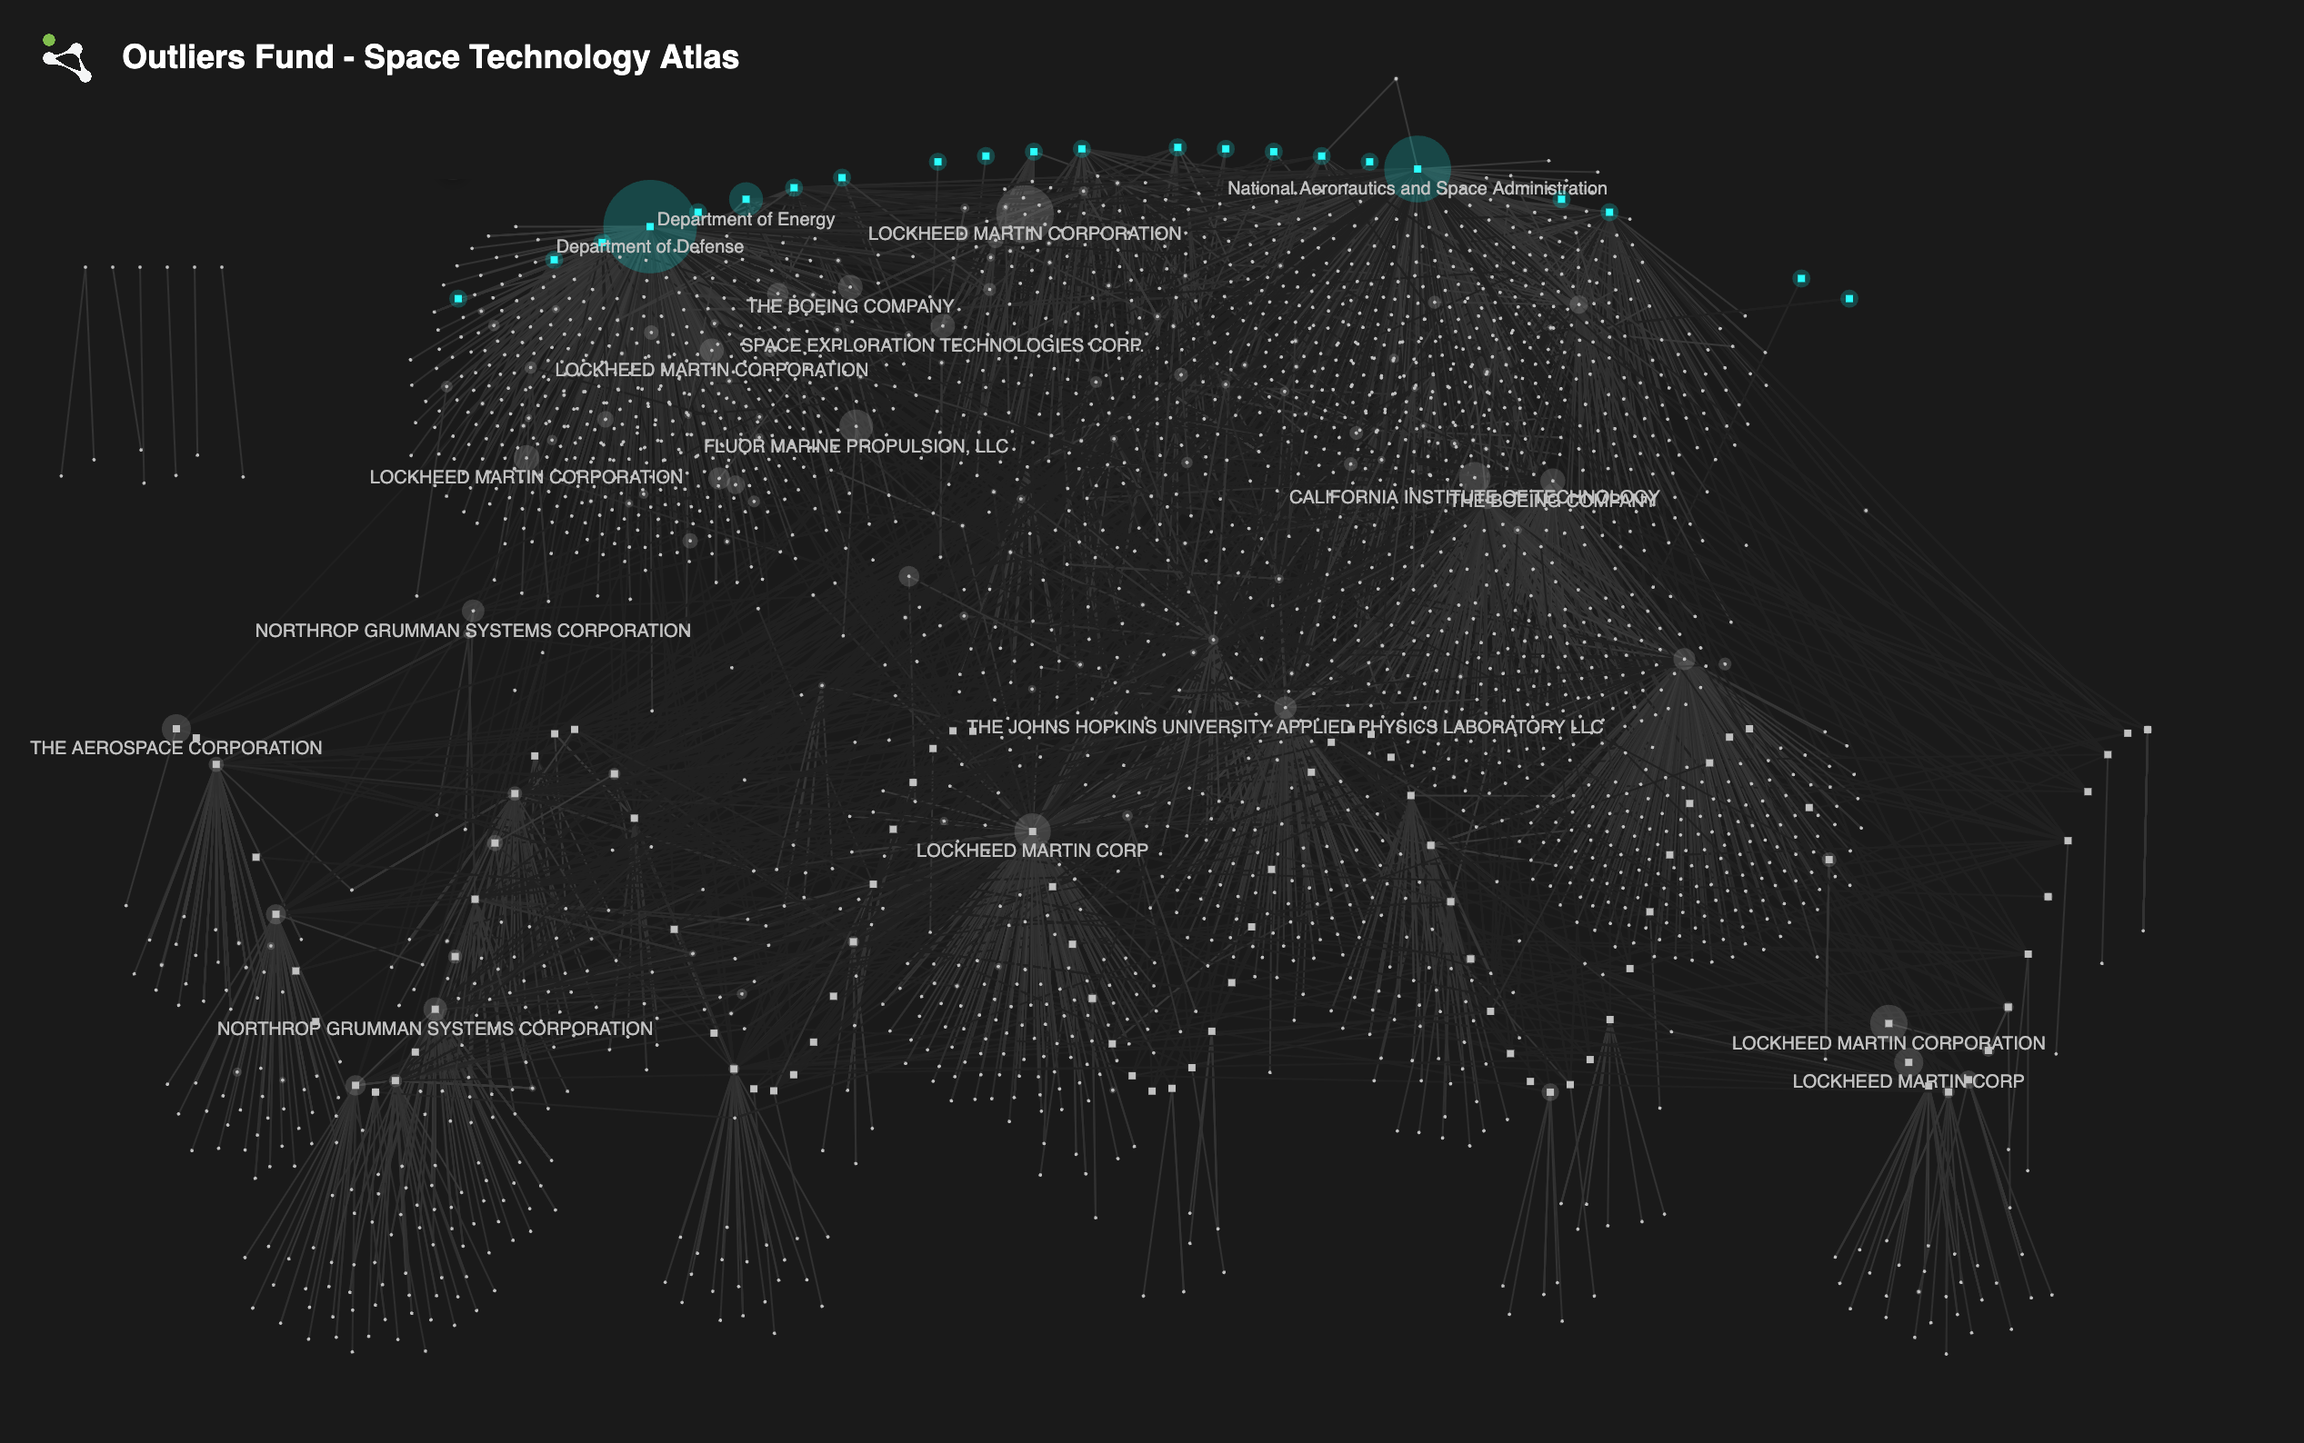 Space Technology Atlas displaying a network of space funding for the year 2024. Nodes represent entities such as space companies or federal agencies. Connections represent a transfer of funds between two entities.
Abstract
The space industry is vibrant, complex, and rapidly evolving, marked by vertical integration within the industry and horizontal integration across diverse sectors, including pharmaceuticals and advanced materials.
Multiple methods exist for assessing investment readiness within specific subdomains. These approaches include analyzing intellectual property trends, monitoring spacecraft and payload deployments, and tracking space-based systems through their entire lifecycle—from design and manufacturing to launch and ongoing operations.
Outliers Fund is developing a first-of-its-kind Space Technology Atlas, a interactive data visualization designed to reveal the intricate landscape of space technology through comprehensive analysis of U.S. federal funding data. Our approach leverages public-private partnerships within aerospace and astronautical technology as primary indicators of sub-sector growth potential. To this end, we built a pipeline of detailed data on U.S. federal investments directed toward both emerging and established space technology firms.
Governments, notably the U.S. along with other major space-faring nations (ESA, JAXA, ISRO), significantly influence the advancement of space technologies. From Kennedy’s Apollo moon missions to recent initiatives such as the establishment of the U.S. Space Force, space remains a strategic priority linked to national security and global technological leadership. Proficiency in space technology underscores a nation’s broader capabilities in designing sophisticated systems and managing complex infrastructures, skills transferable across competitive domains.
By examining patterns of governmental investments, we deepen our understanding of the space industry. Our objective is to identify subindustries that exhibit strong potential through aligned public priorities and market forces, promoting coordinated advancement and sustained innovation.
Methodology
U.S. federal agencies allocate funds primarily through two mechanisms: financial assistance and contracts. Each method provides distinct insights.
- Thanks to the 2014 Digital Accountability and Transparency Act, which expanded on the 2006 FederalFunding Accountability and Transparency Act, high quality data on public expenditures are available via USASpending.gov and other data brokers.
Financial assistance typically takes the form of grants that fulfill Congressionally defined public purposes such as research, development, or economic growth. Grants are often awarded through open-call proposals, allowing recipients considerable flexibility in defining their project scopes. Contracts, by comparison, are more rigid, representing the government’s official procurement process for acquiring specific goods or services for direct federal use. Awarded through competitive bidding, contracts usually favor entities with established buyer-seller relationships with the government.
- Many gallons of ink have been spilled in literature around modernizing federal procurement. Notable policies include the A-76 framework for competitive sourcing and the Brooks Act for rigorous assessment of contractors over purely price based bidding. These policies significantly impact the profile of nonfederal entities the federal government transacts with and are themselves a worthy, still evolving case study.
Our assistance and contract data captures the ways non-federal entities transact with other non-federal agencies. Assistance and contract data come in the form of prime and sub awards. Prime awards represent the transaction between a federal agency and a non-federal agency, for example, a contract from the Department of Defense (the prime awarding agency) for an engine from Boeing (the prime awardee). Sub awards represent the transaction between a non-federal agency (the prime awardee) and a non-federal agency of its choosing to support in carrying out the federally defined prime transaction, for example, a contract from Boeing (the prime awardee and the sub awarding entity) to Desktop Metal (the sub awardee), a metal 3D printing company, for rapid prototyping services. Thus, we start to unravel two layers of transactions: federal to non-federal, non-federal to other non-federal. Note that non-federal does not mean private, though private companies do make up a large part of this pool. A sampling of non-private, non-federal entities: universities with research mandates and in some cases engineering contracts, state and district level departments for building out space-related infrastructure, and national science associations for promoting space literacy and internally distributing grants. Of course, tracing federally accounted space transactions is not a complete state-space search. We miss out on privately driven sectors, such as space tourism and communication satellites. Indeed, we use our current tool as a first pass, a home base to later couple our public analysis with larger pools of private sector data and insights.
We pull financial assistance and contract prime and sub awards from 2016 onwards. We choose 2016 as our lower bound to follow the evolution of the space industry post-SpaceX’s historic Falcon 9 returnable rocket body mission. The data is cleaned (filtering out for mismatched keyword searches) and categorized into 53 subdomains:
The general data structure used to generate our tool, a directed force graph of transactions, are nodes (federal agencies and non federal awardees), edges (financial assistance prime/sub awards, contract prime/sub awards), and domains.
Using a combination of NLP API calls and cosine similarity analysis on transaction descriptions, catalog of federal domestic assistance (CFDA) federal program listings, North American industry classification system (NAICS) codes, and awarding agencies, we tag every edge by its relevant domains. The final visualization captures transaction details and aggregate statistics of a pool of nodes over time, with top entities, by amount received and amount given, are most visible.
This general data processing and visualization pipeline can continuously be infused with new transactions as the fiscal year progresses. Further, it is designed to be extensible to other domains and is particularly well suited for industries with tight governmental regulations and necessary public relationships to propel the technology stack from design and development to implementation.
Results and Discussion
We processed 7,625 entities and 52,579 awards from 2016 to 2025. During this period, key federal funding sources include the Department of Defense ($143.2 Billion) and NASA ($60.5 Billion), while prominent industry entities by total transaction volume feature Lockheed Martin ($56.4 Billion) and Jacobs Technology ($12.4 Billion).
The federal funding landscape, as of 2024, is at an all time high of $29.9 Billion in yearly prime awards. However, sub-transactions between non-federal entities appear to have peaked at $11.7 Billion in 2021, and have since declined nearly 80% to $2.4 Billion in 2024.
There are several plausible reasons why space technology subcontracting was nearly five times greater in 2021 compared to 2024:
-
Major Space Programs and Funding Peaks: In 2021, NASA and contractors ramped up spending significantly in preparation for Artemis missions, driving a surge in subcontracting activities
-
Post-COVID Economic Stimulus: The U.S. federal government released extensive economic stimulus funds in 2021, with a significant portion allocated toward research and infrastructure, including space technology. Subcontracting often spikes as prime awardees distribute funds downstream to specialized subcontractors.
Top Federal Entities
During the entire period of study, top federal agencies by amounts awarded are:
Top Non-federal Entities
During the entire period of study, top non-federal entities, by total transacted amounts (given and received) are:
1. Lockheed Martin Corporation: $56.4 Billion
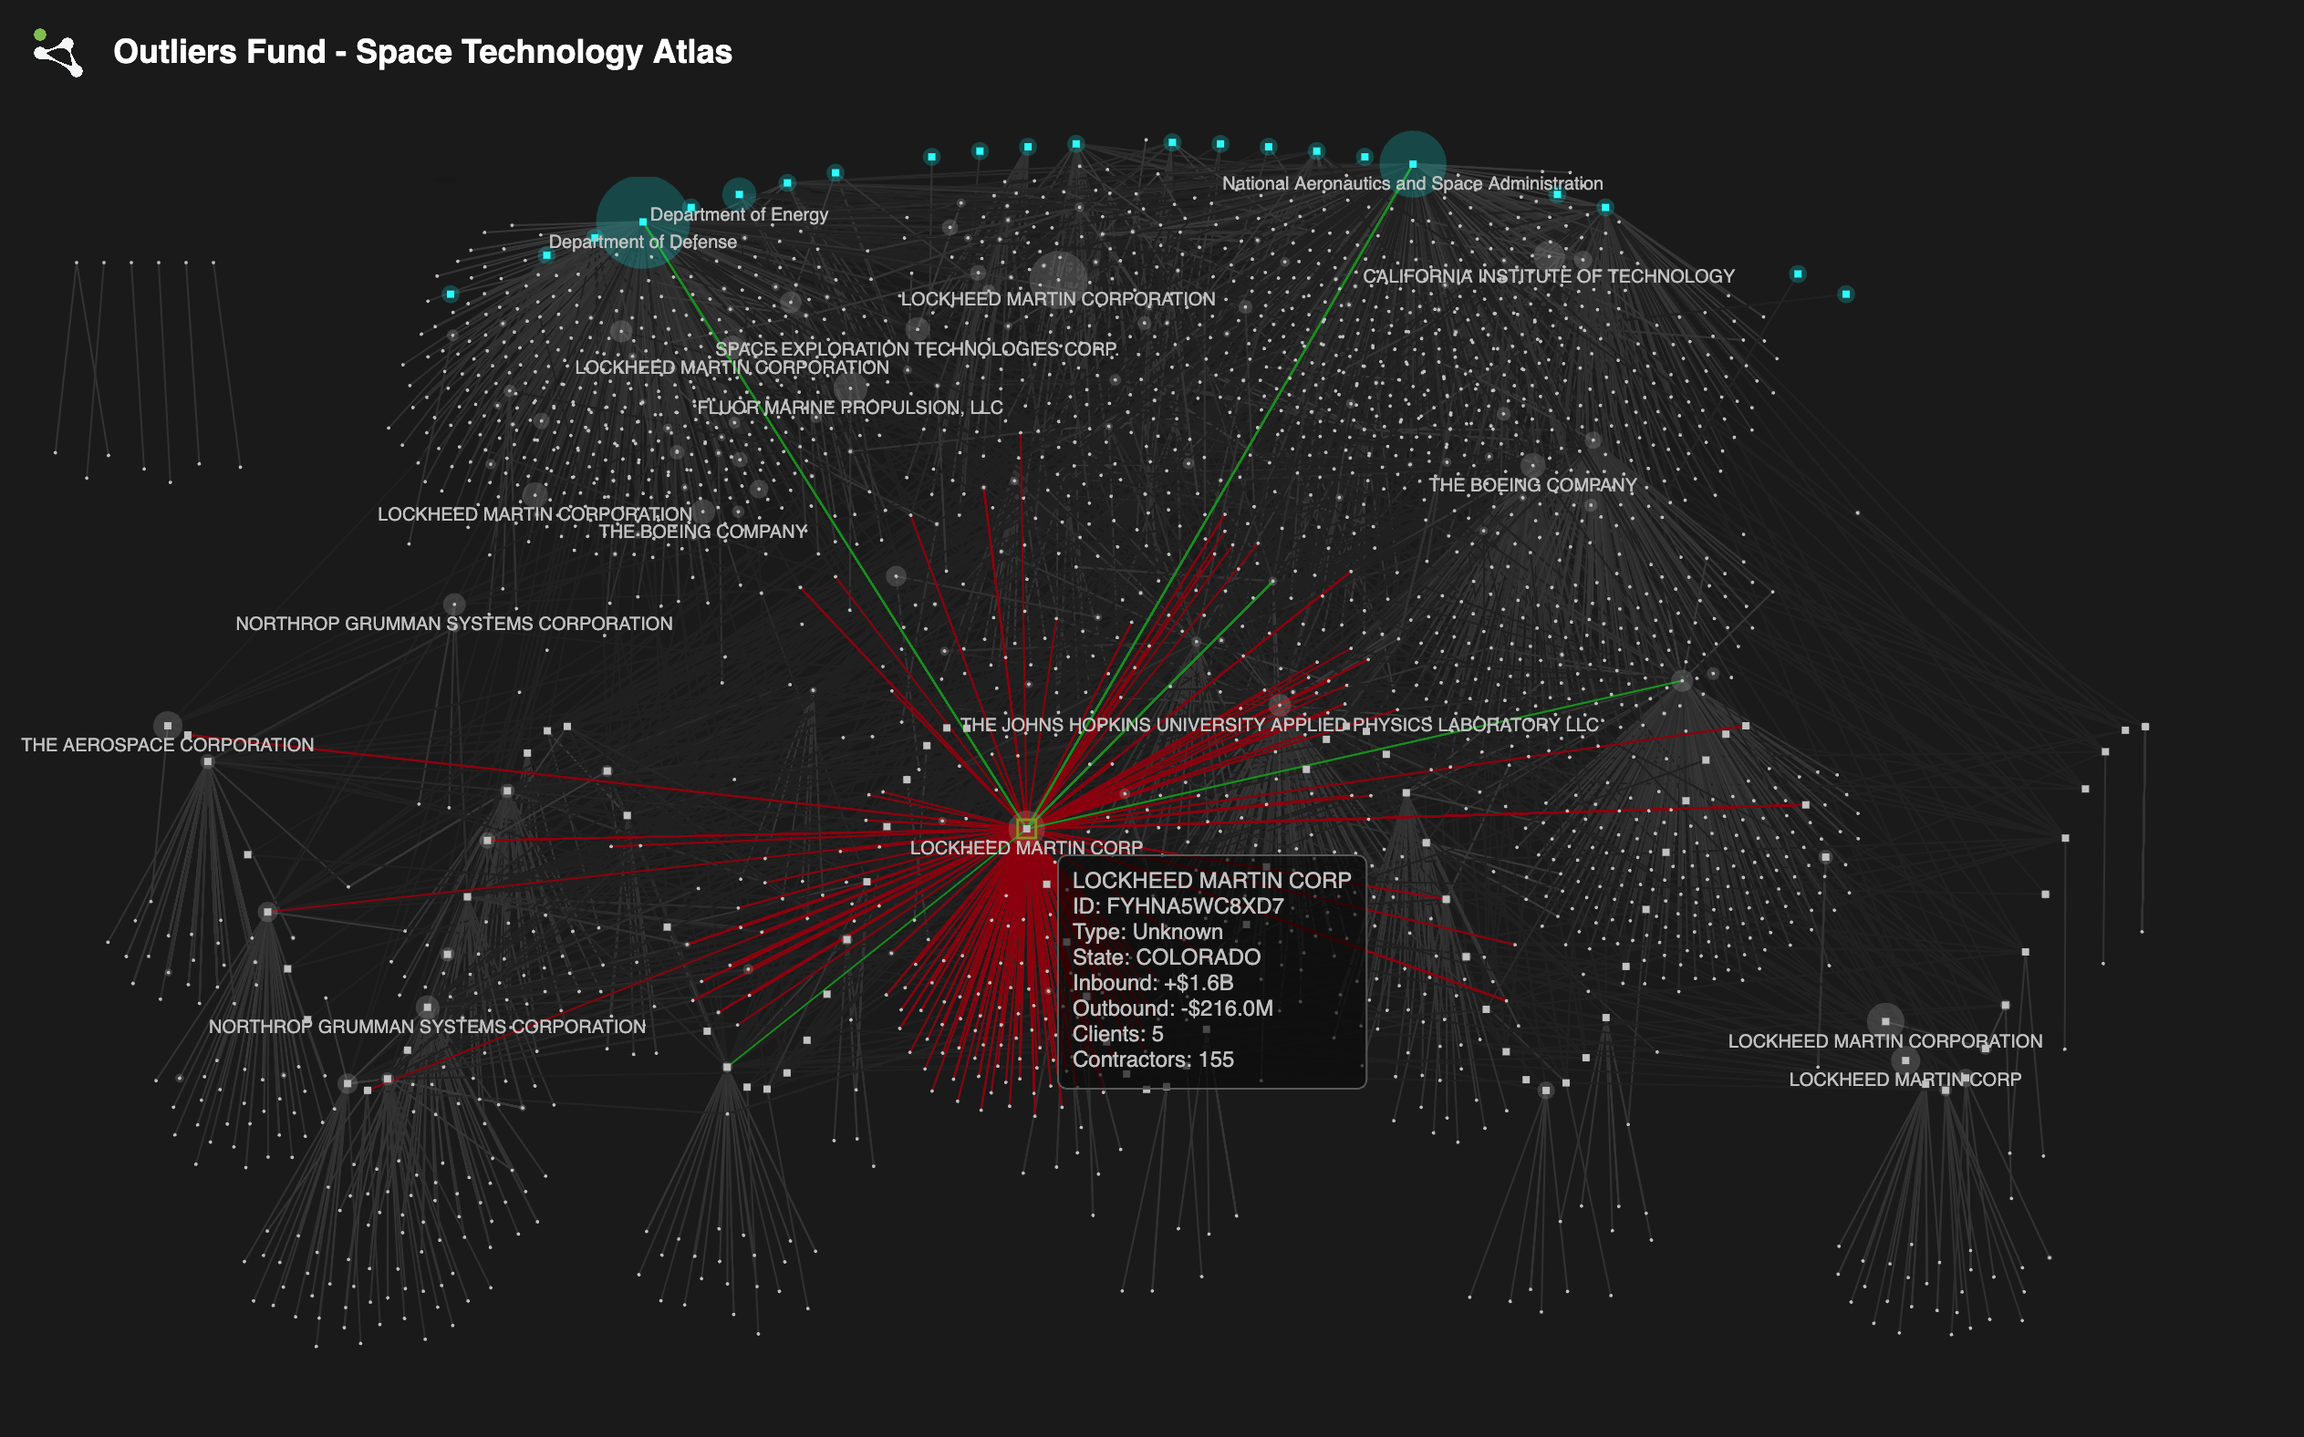 Certain large organizations, such as the Colorado branch of Lockheed Martin, serve as important conduits for federal funding. They not only receive a large amount of federal funding, they redistribute federal grants to subcontractors.
Domain Clusters
Filtering the graph to display transactions from specific domains can reveal meaningful clusters and patterns within the space technology landscape. By isolating particular sectors—such as satellite communications, launch vehicles, or space robotics—you can identify concentrated hubs of activity and investment. These clusters highlight tightly integrated networks of companies, government agencies, and research institutions, uncovering strategic partnerships and supply-chain dependencies. This focused view enables investors and analysts to pinpoint emerging market leaders, potential collaborative opportunities, and critical areas of technological advancement.
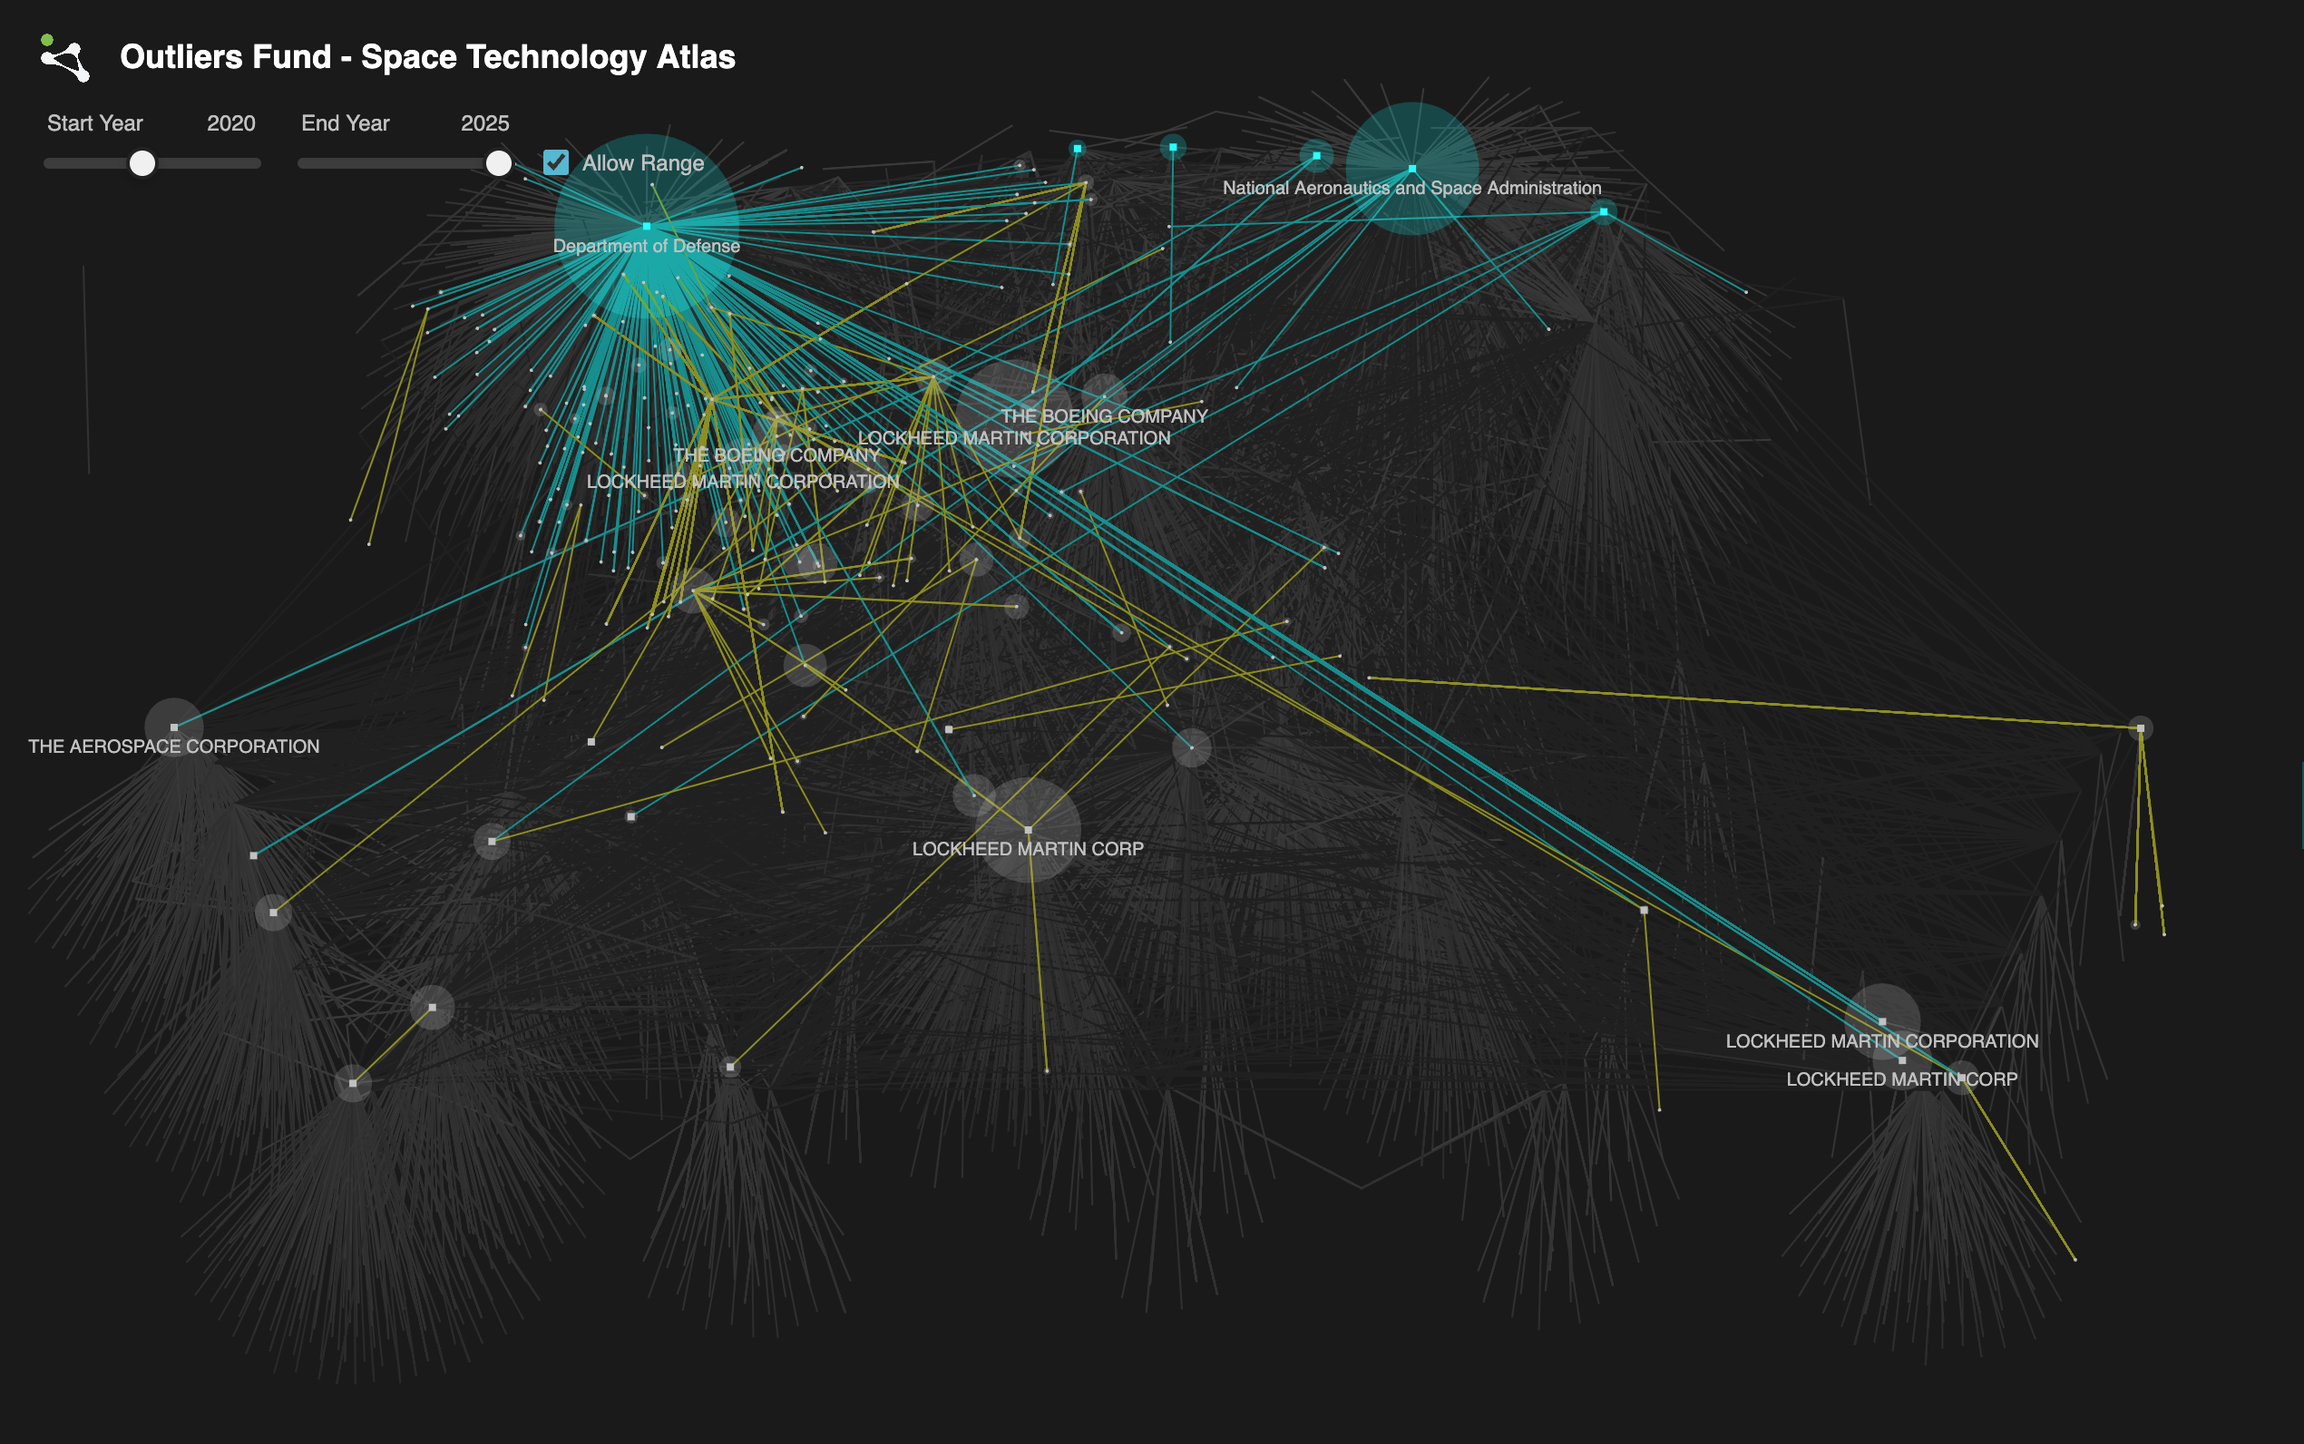 This is the network of entities and transactions related to observed “military” applications from 2020-2025. This is a relatively small network of 269 entities sharing 640 awards worth $23 billion. The largest awarder is The Department of Defense. There are relatively few awards, but the awards are fairly large.
 This is the network of entities and transactions related to “Lunar Exploration” and “Mars Exploration” from 2020-2025. This is a broad network of 481 entities sharing 1,918 awards worth $3.4 billion. The largest awarder is NASA. The awards are relatively numerous but small.
Discussion
Domain trends are one of many research avenues enabled by this visualization tool. As an investment strategy, we can integrate space-focused venture capital portfolios within the federal funding landscape, simulating real historical environments to test entry and exit scenarios. To evaluate new ventures, we can analyze intended domains by examining node clustering, relationships across research, development, suppliers, and historical partnership and transaction trends. Domain transitions can reveal optimal integration strategies—both vertical and horizontal—for startups.
As a predictive instrument, the tool can refine data processing pipelines and aggregate indicators to highlight emerging technologies before they reach market saturation, leveraging domain incidence rates, keyword clustering, and funding trends. Future iterations could link financial market activities with ongoing policy developments and related governmental actions. While some industry sectors, such as satellite communication bands, have clear regulatory frameworks, others like deep space exploration, tourism, and mining remain emerging, with regulatory impacts still uncertain.
Rather than prescribing fixed investment targets through static reporting, this tool aims to inform a dynamic, algorithmic investment strategy. It serves as a resource for data-driven case studies and integrated computational approaches to validate investments—a core tenet of Outliers’ philosophy. The Space Technology Atlas represents our initial step toward applying this computational ethos toward understanding space industry.
Contributors: Sophia J. Wang, Ira Winder
For more info about Outliers Fund, please visit https://outliers.fund